
ENERGY MATRIX 08/07/2022
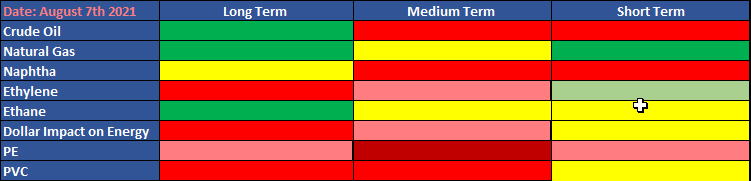
Energy market is now showing a bearish situation along the whole crude oil downstream chain, as shown in the corresponding daily charts. Clc1 is making a deep exploration into the 200 EMA 450 EMA strong support areas. However, despite Natural Gas downstream chain is also down, the NGc1 is still showing a relative strength compared to the oil energy chain, which is obviously due to the current critical natural gas supply in Europe. NGc1 is also showing a price pullback, but into the 20 EMA.

CLC1 Crude Oil Daily Chart provided by MetaStock, Alerts provided by e-globalTrading
Note a couple of e-globalTrading high quality SELL alerts named X Xtreme Momentum alerts in the corresponding CLC1 daily chart, Those alerts are showing strong arguments for the bearish cause. However, bulls also have solid arguments coming from the very strong crude oil daily support areas, which were marked with blue color lines.
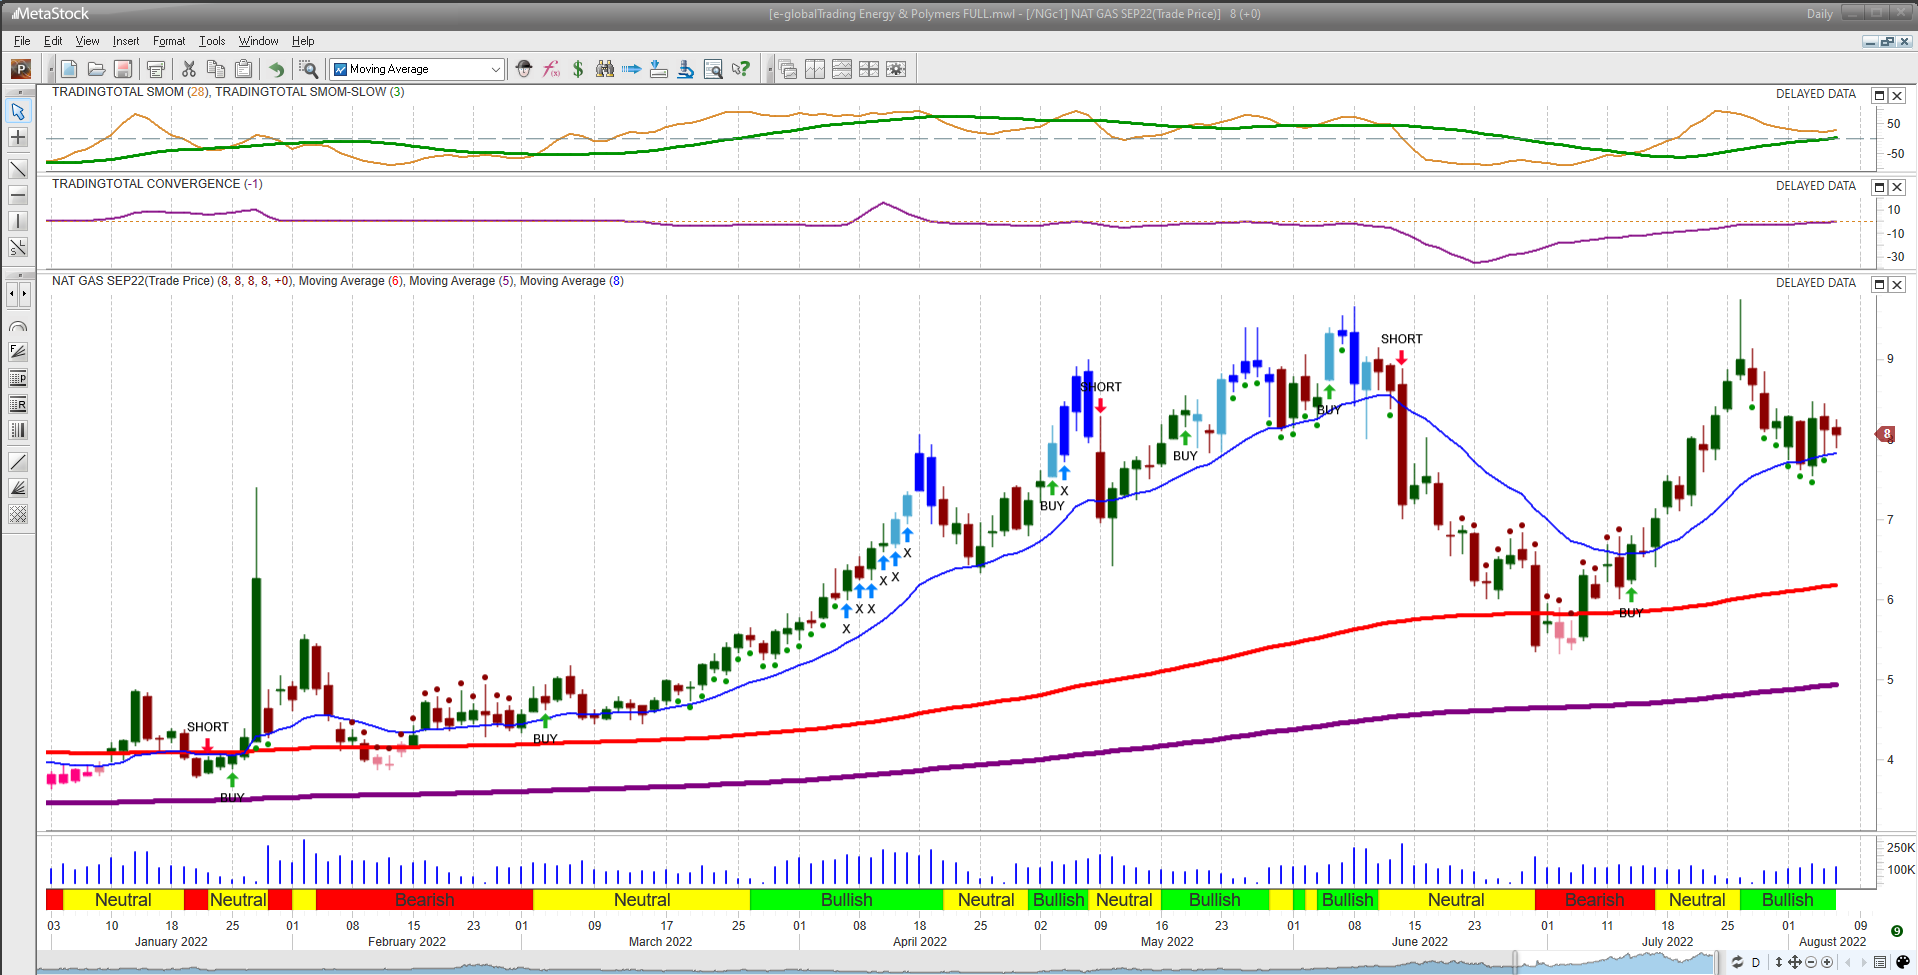
NGc1 Natural Gas
Let’s take a look at the rest of the energy downstream, naphtha, ethylene, ethane and polymers.
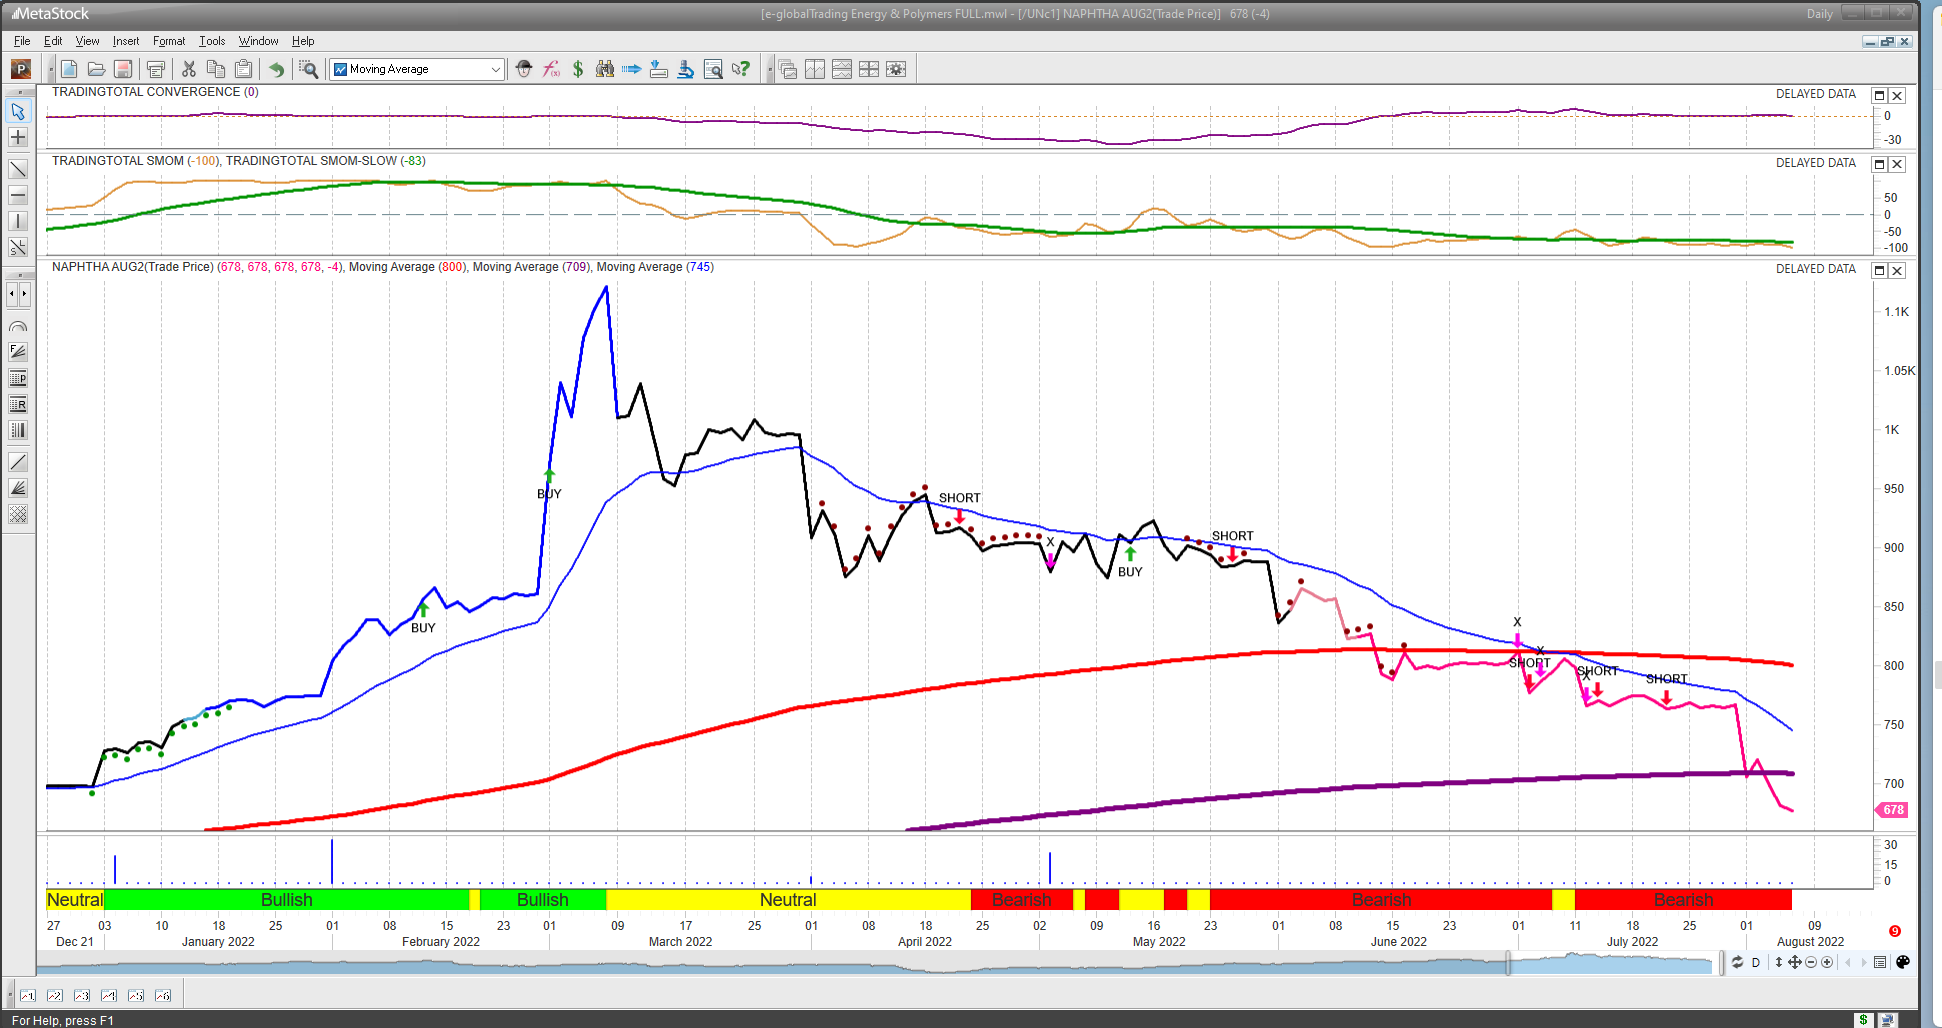
UNc1 Naphtha Daily Chart provided by MetaStock, Alerts provided by e-globalTrading
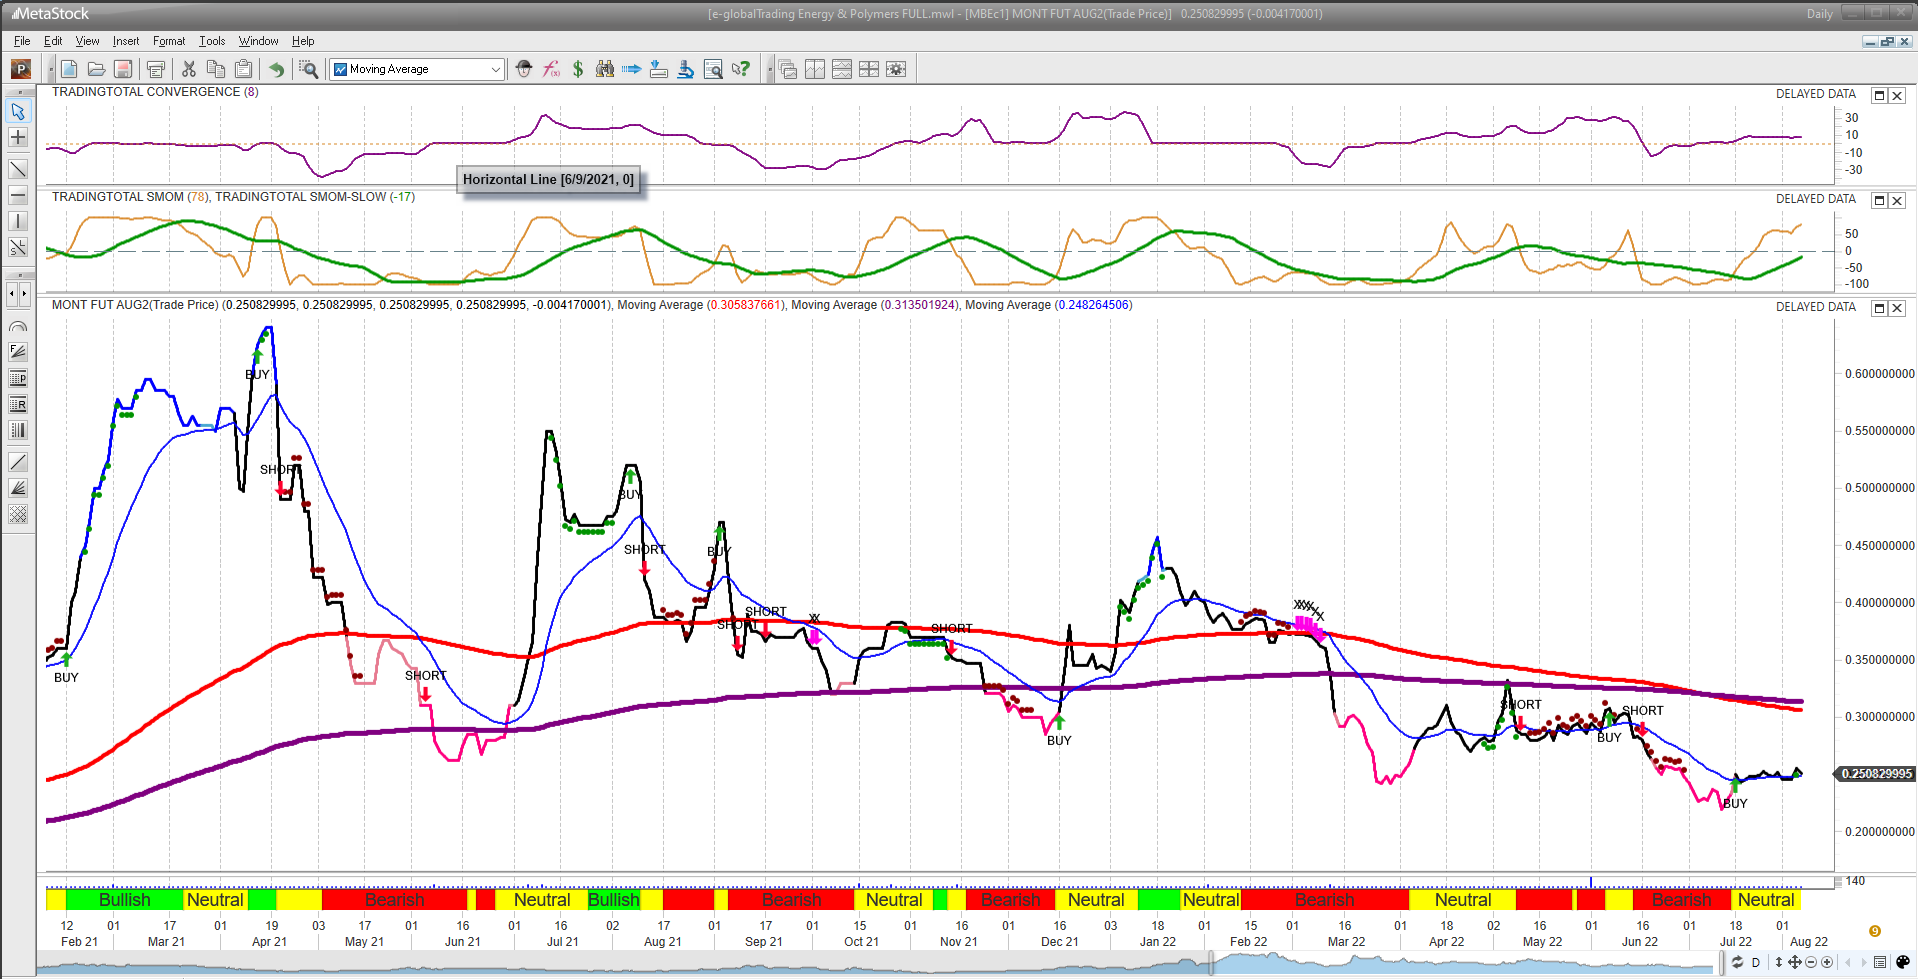
MBc1 Ethylene Daily Chart provided by MetaStock, Alerts provided by e-globalTrading
Please, also note that the whole crude oil downstream chain is aligned with the weakness shown by the crude oil driver. Al the referred energy, instruments are showing recent successful e-globalTrading alerts to reinforce the whole crude oil derivative sector weakness.
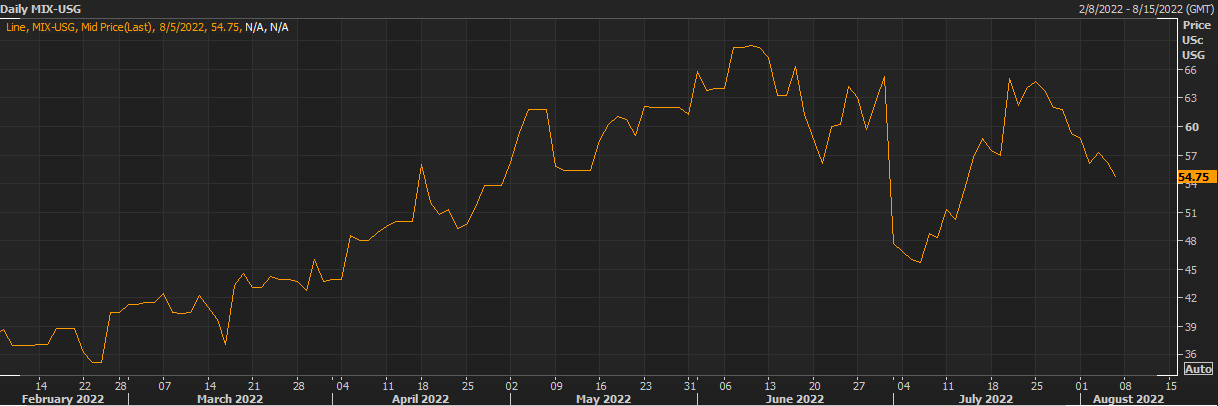
MIX-USG Ethane Daily Chart provided by MetaStock
Regarding polymers, LLDPE and PVC are both also experiencing strong prices weakness. Also, note that the corresponding daily charts are showing some PVC relative strength, according to the SMOM indicator showing some up momentum being built for the PVC resin.
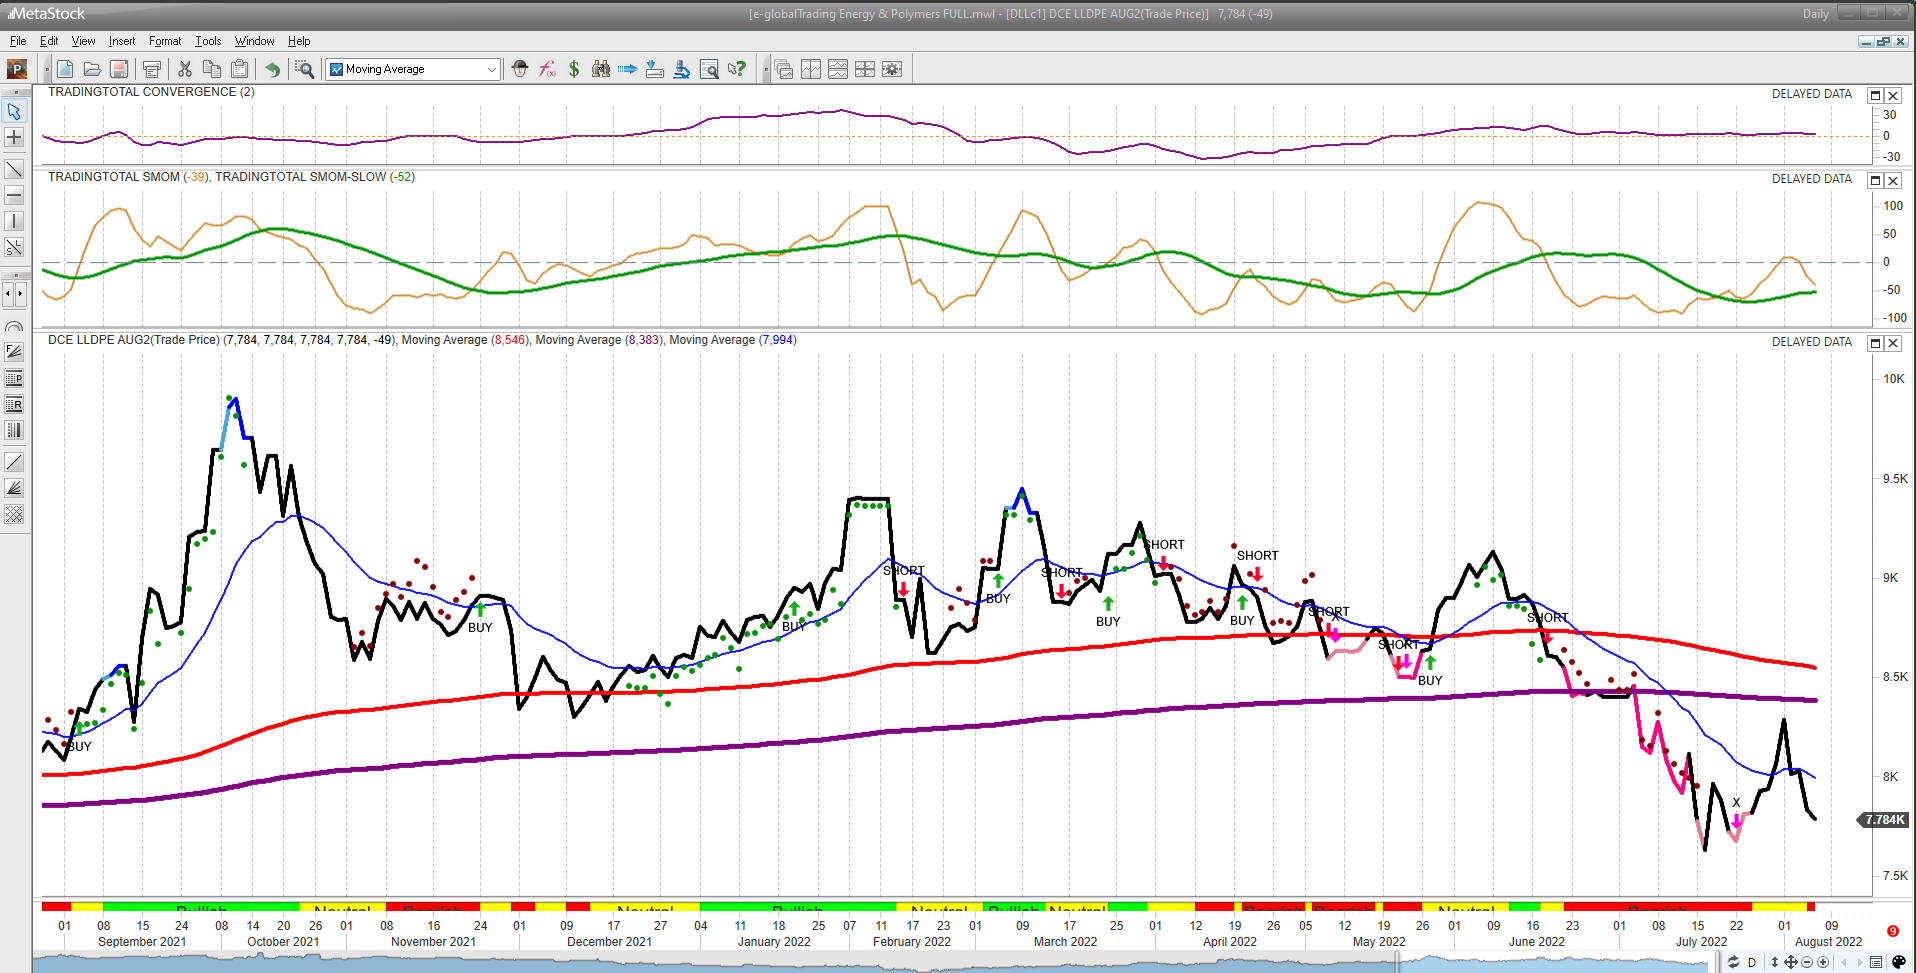
DLLc1 DCE LLDPE Daily Chart provided by MetaStock, Alerts provided by e-globalTrading
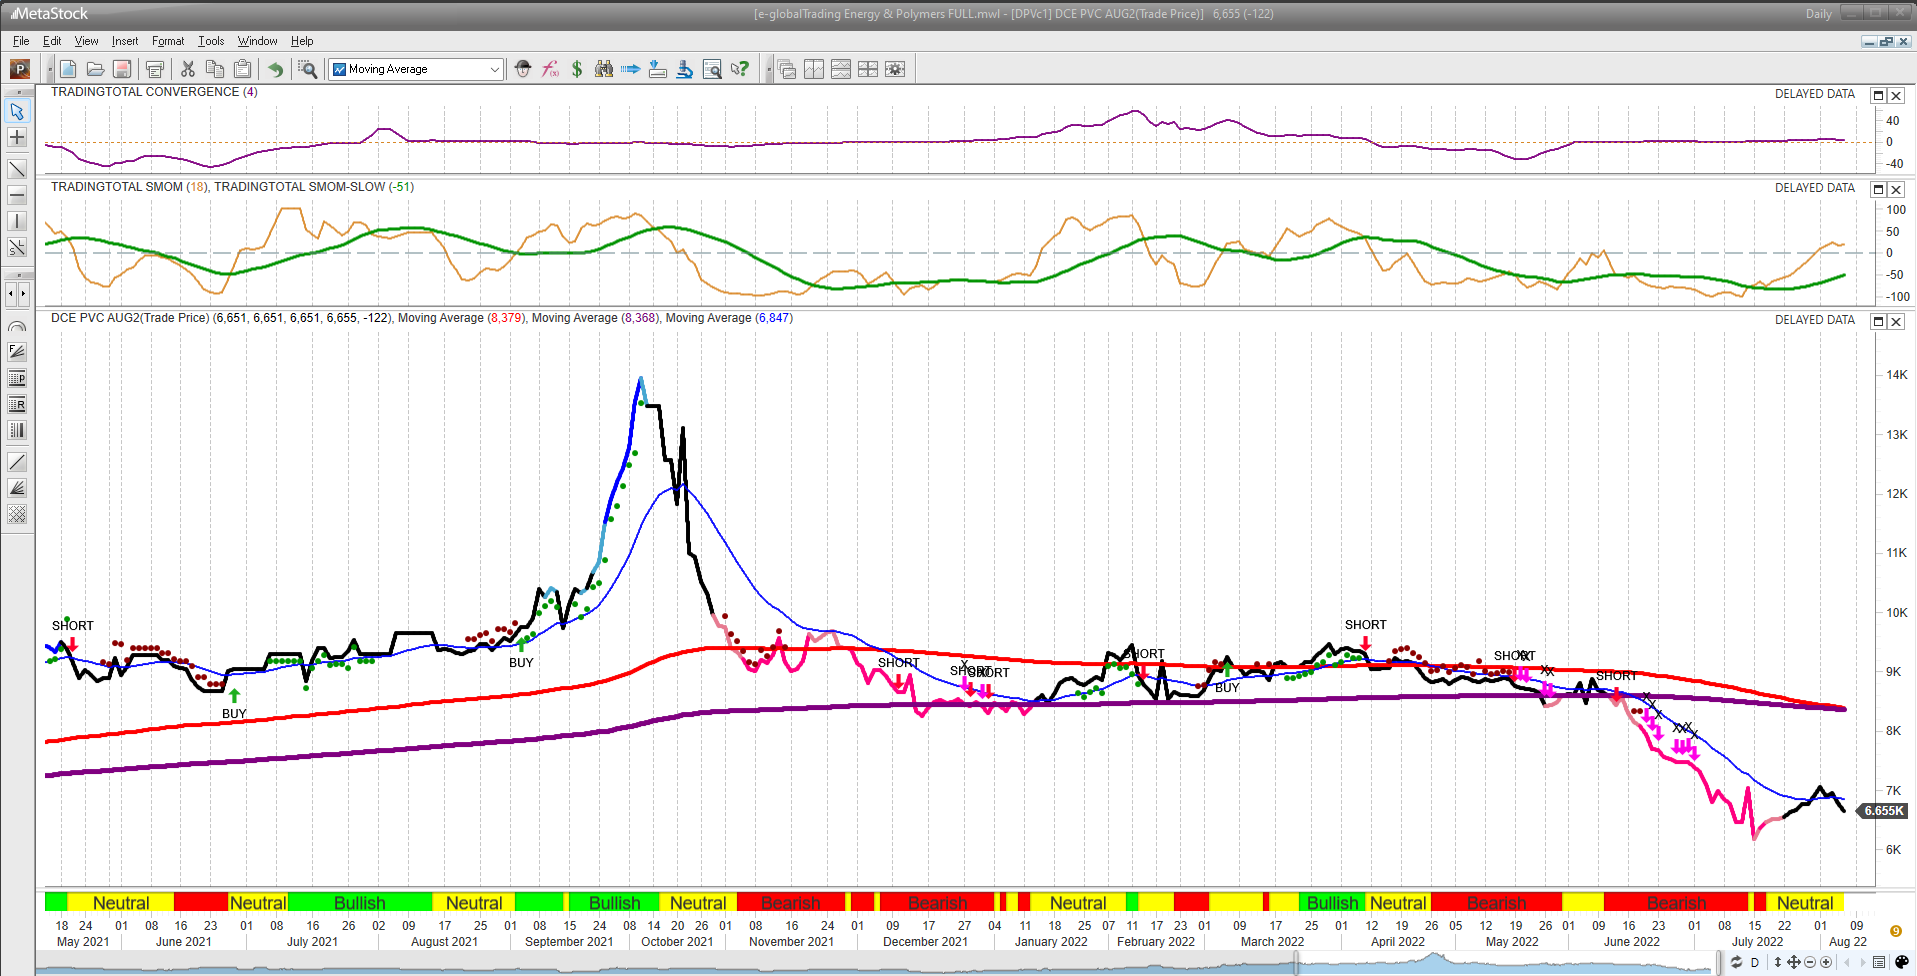
DPVCc1 DCE PVC Daily Chart provided by MetaStock, Alerts provided by e-globalTrading
Finally, the USD dollar price situation still shows a Dollar Index DXc1 technical strength, despite the past 2 weeks USD dollar recent pullback, which means USD dollar is still supporting the recent crude oil bearish behavior.
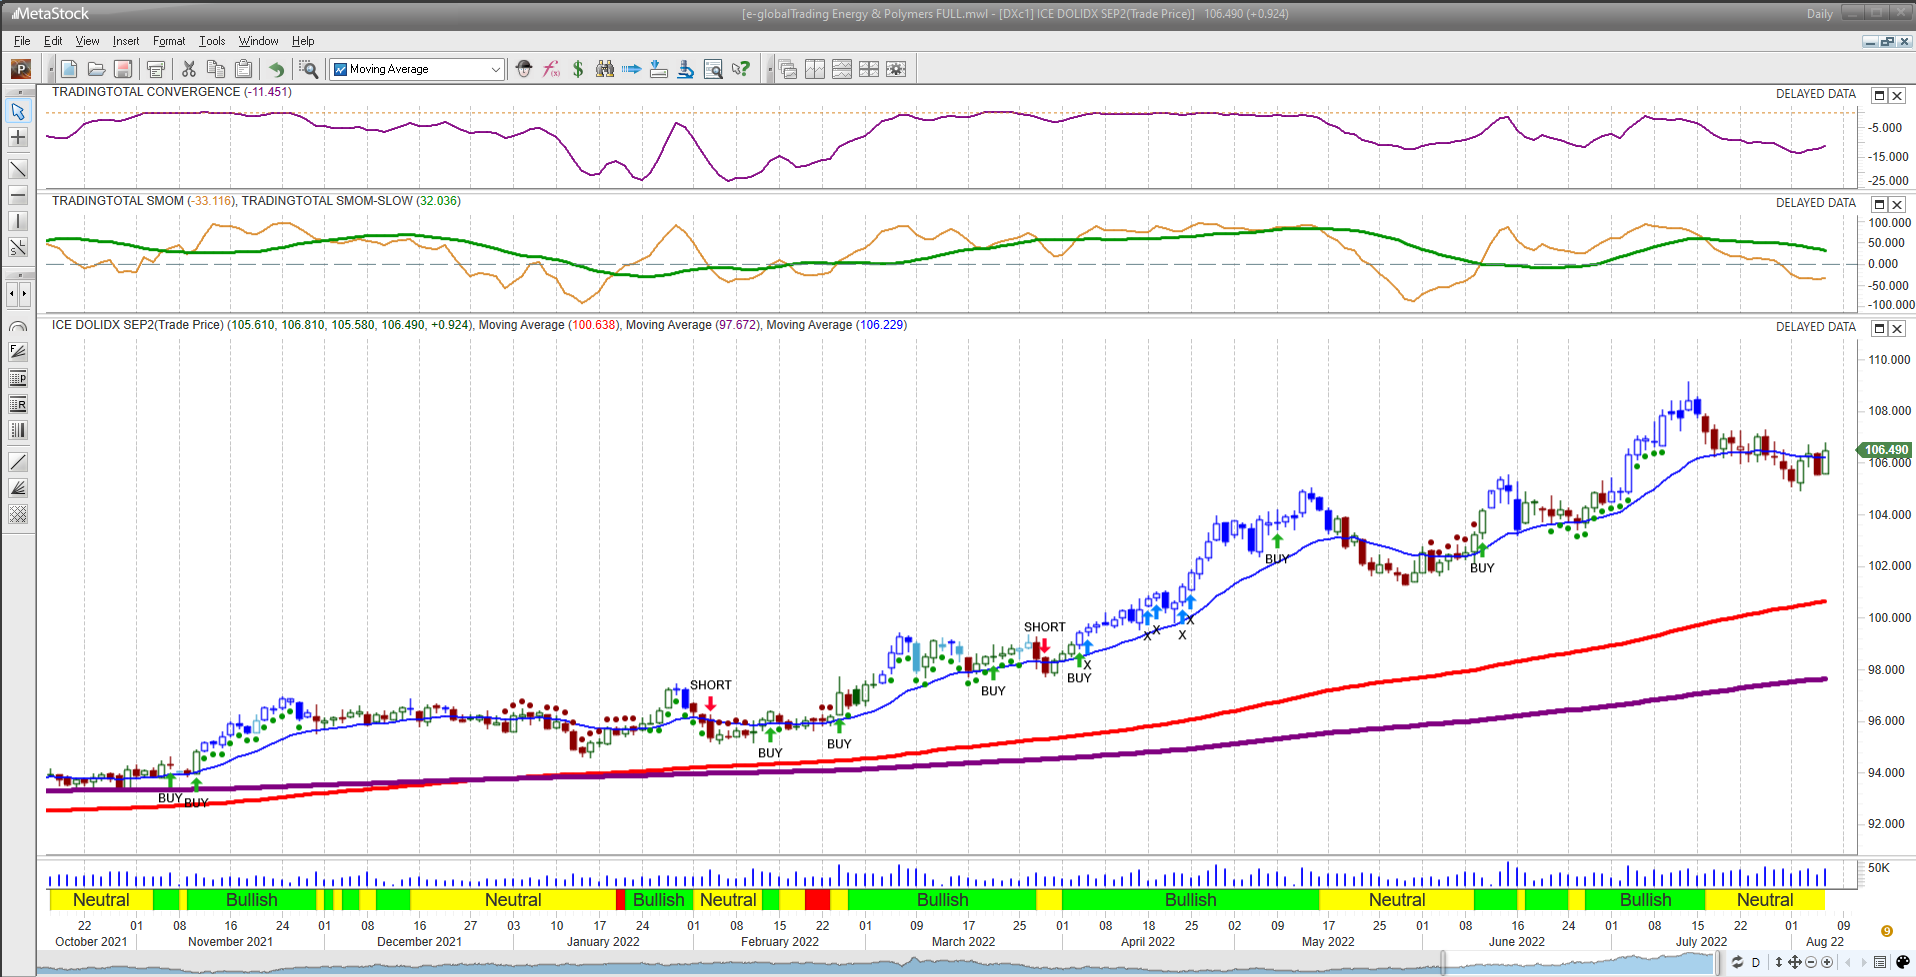
DXc1 USD Dollar Index Daily Chart provided by MetaStock, Alerts provided by e-globalTrading
If USD Dollar finally breaks the current support 105 area, perhaps, Crude Oil would have an additional reason to continue drilling down, right into the 82 USD price area, where the 450 EMA (violet line) is shown as a powerful support area.
In short, next week will be a challenging one for sellers, as crude oil is still on daily support, a very strong one actually.
At the same time, from the fundamental point of view, the geopolitical scenario is anything but bearish for energy, due to Ukraine-Russia war, Taiwan-China-USA potentially dangerous scenario, as well as the current bearish global inflation impact.
Stay tuned!


