
About one year ago, Crude Oil was struggling to overcome the 84 USD/barrel price. 84 USD was a key CL price level, which was broken down in October 14th, 2014. The referred break-down triggered one of our e-globalTrading strongest SELL calls ever, to carry out a 40 USD down move in just 90 days.
It was necessary to wait until the COVID 19 showed-up to see a similar linear and fluid price decrease, 30 USD in just a few weeks of pandemic meltdown.
Something similar happened one year ago, after Russia invaded Ukraine in February 2022. The whole world panic and CL price skyrocketed 32 USD in matter of days, reaching 116 USD/barrel in March 8th, 2022.
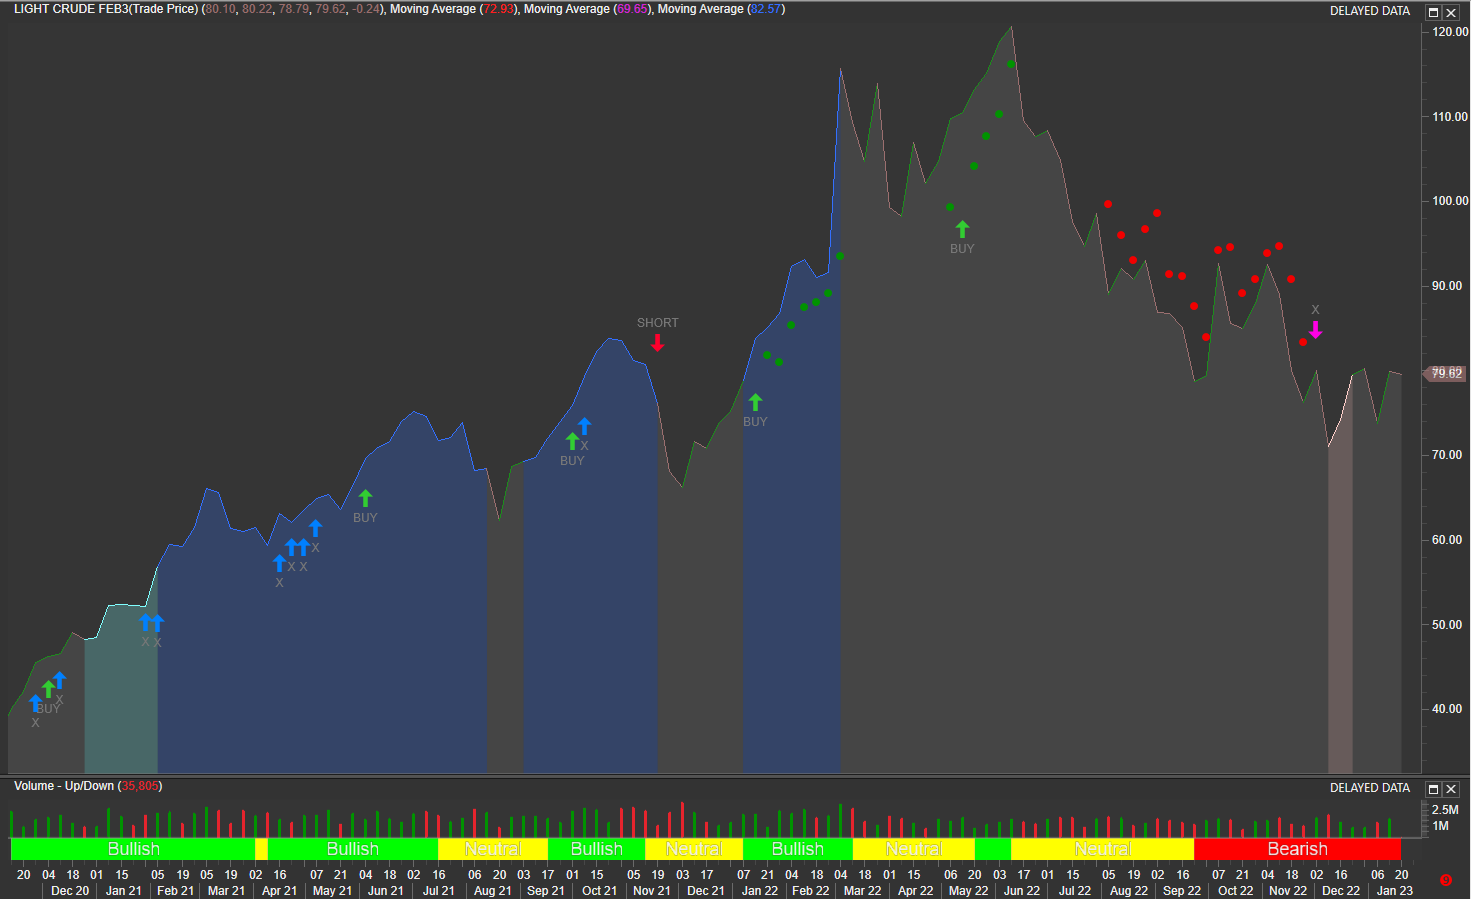
Crude Oil CLc1 futures contract in Weekly time frame. Chart provided by MetaStock powered by Refinitiv. Alerts provided by SMART e-globalTrading Trading Alerts System
Conclusions and similarities between all those events:
· Fear is a powerful Crude Oil price driver
· The whole market is very uncomfortable with Crude Oil prices above the 80-85 USD trading range.
· Crude Oil charts began to show the big players (market makers) activity a way before the “action” or triggering events were confirmed.
· Our e-globalTrading SMART Alerts were 100% accurate to profit all those big down/up moves. Just observe our SMART color backgrounds ALWAYS “ON” during any strong and linear up/down price move.
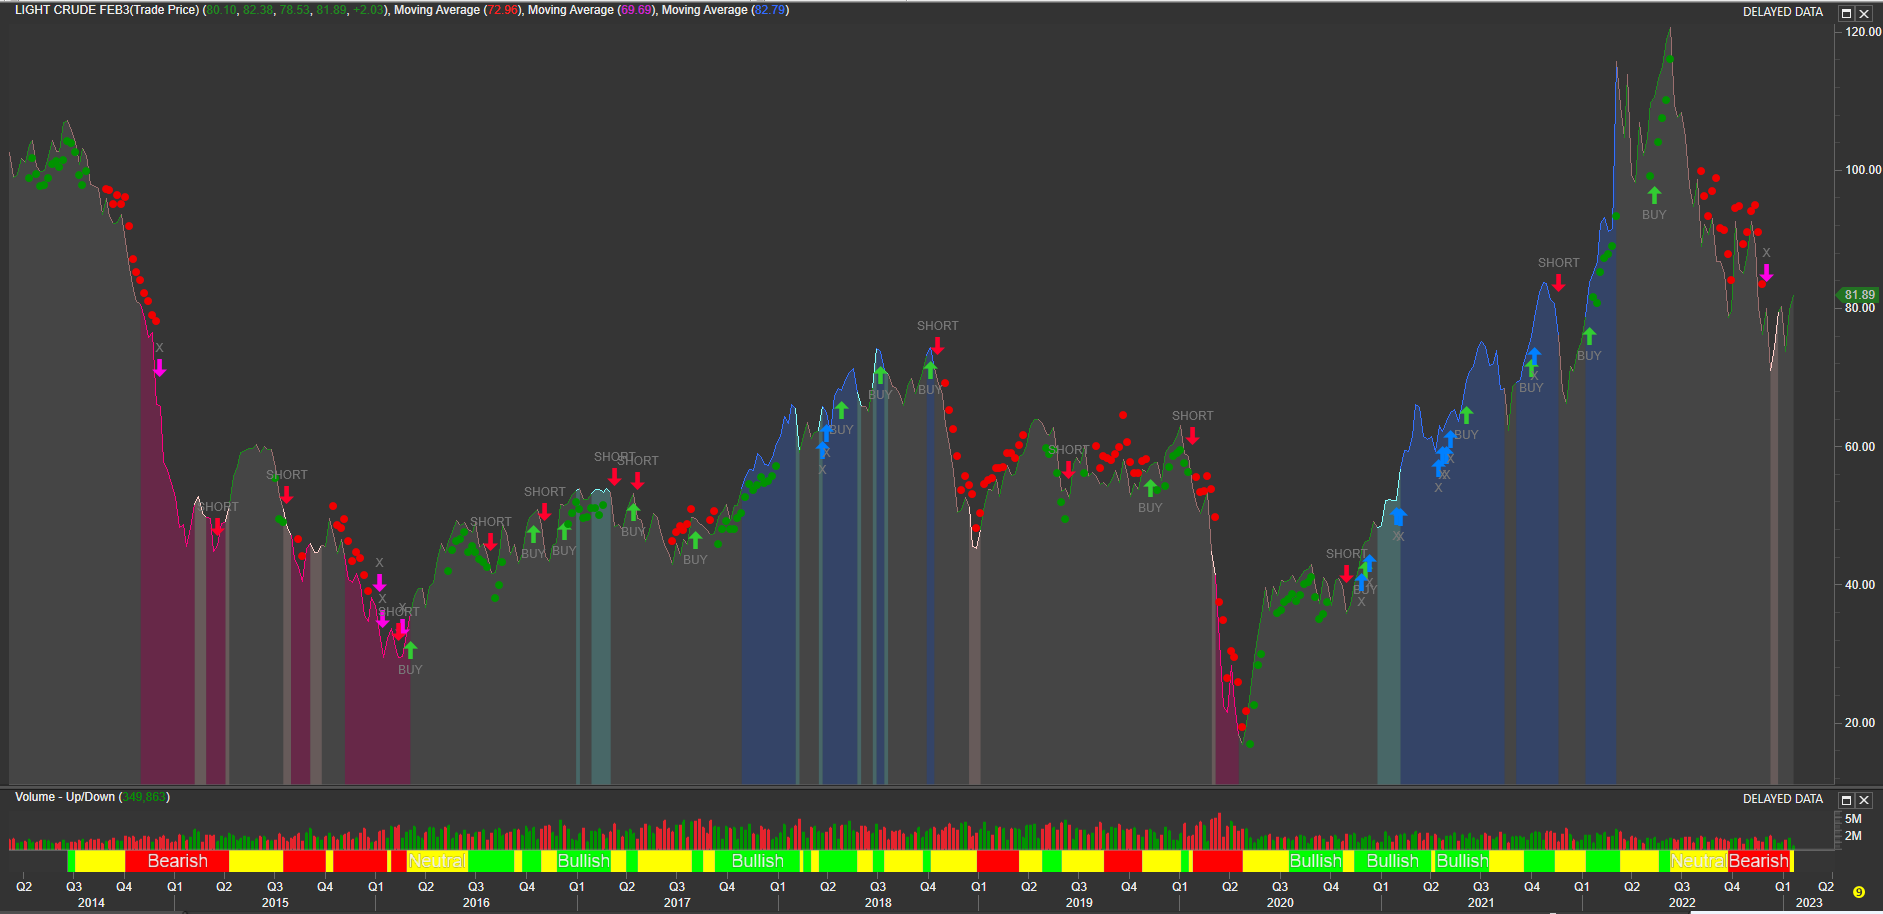
Crude Oil CLc1 futures contract in Weekly time frame. Chart provided by MetaStock powered by Refinitiv. Alerts provided by SMART e-globalTrading Trading Alerts System
Finally, what are we expecting to happen with the Crude Oil price in the near future?
That’s probably a tough question. What is clear is that’s a fundamental moment, showing 2 main drivers, geopolitical scenario, USD Dollar and inflation/interest rates.
Current USD Dollar weakness could continue for some time. Technicals still show support into the Daily 450 EMA at about 102 DXc1 (Dollar Index). We think Dollar Index 102 is a tipping point. If this powerful support level is finally broken and at the same time geopolitical situation in Ukraine and Europe become worser, Crude Oil could start to go up to challenge the 90 USD/barrel price area. We are not talking about a direct war between NATO and Ukraine, we are just talking about an increase of the current war activity.
Just to illustrate how tense the current situation is, last week, the former Secretary Condoleezza Rice, a very known specialist in Russia affairs, warned about the risk of an emboldened Putin who, according to her understanding, doesn’t conceive the Russian Empire without Ukraine. Condoleezza Rice added that USA and Allies should be seriously considering in supporting Ukraine with all the weapons and logistics needed to expel Russia out of Ukraine. Otherwise, according to the article published last week in The New York Times, Occidental countries will probably be losing the chance to end the war without direct intervention. A couple of days after the referred Condoleezza Rice and Robert Gates article was published by The New York Times, United Kingdom made the historical decision to provide Ukraine with the most advanced Tank vehicles to revert the war. Long range weapons option seems to be also on the table, with the obvious geopolitical destabilization consequences.
On the other hand, supply and demand is also part of the oil price equation, since a very likely recession is openly considered by Wall Street and specifically by the banking sector. Interest rates increase is starting to show impact on Main Street.
So, what crude oil charts are now showing us?
CL charts are showing exactly what we said: Sideways price behavior (no color backgrounds) and a lot of volatility, which means uncertainty. Since we don’t have any intense SMART color backgrounds neither daily nor weekly, charts say that we don’t expect strong and sustained up/down moves any time soon. However, there is a down trend still in place since the 95 USD area support was broken 6 months ago.
In short, stay tuned and observe the e-global Trading SMARTS Alerts to eventually anticipate any potentially strong up/down CL price move.